SemGraph Apps
Software suite for assembling and operating graphs of knowledge according to semantic web standards.
Software suite for assembling and operating graphs of knowledge according to semantic web standards.
Based on web standards and a decentralized architecture, the independent tools of the SemGraph suite complement each other to enable the linking of data coming from multiple disjointed applications.
The knowledge graphs thus constructed provide unparalleled value by revealing previously invisible relationships and by serving as a foundation for multiple applications of artificial intelligence.
Identify external data and repositories to be reused and integrated to build your graphs.
With SemGraph Datacat or CKan or Udata, share your datasets to allow them to be reused.
With SemGraph Datasearch indexing multiple open data catalogs, find the reference data that will save you time.
With Webvowl and Widoco, publish documentation of your OWL ontologies and associated SHACL rules.
Assemble the data from the different sources to form a graph not forgetting to align the repositories with each other, then expose the graph by following the web standards.
With SemGraph Rodolf, the various contributors announce the publication of their datasets and validate them, then define their graphs in the form of assemblies.
With SemGraph Nazca, write procedures for matching and merging large datasets.
With OpenLink Virtuoso, Apache Jena or Ontotext GraphDB, make your graph searchable in SPARQL.
Use generic tools to check your graphs, get out of them. graphical visualizations, extract parts to be reused, etc.
With SemGraph SPARQLExplorer, navigate SPARQL searchable warehouses as if they were websites.
With CubicWeb, upload a web portal that exposes your RDF graph data by presenting each resource on its own page.
With Jupyter and the Python language, create visualizations of data that combine explanations, diagrams, and interactive interfaces.
Use SemGraph suite software and web standards to assemble and use your own knowledge graphs.
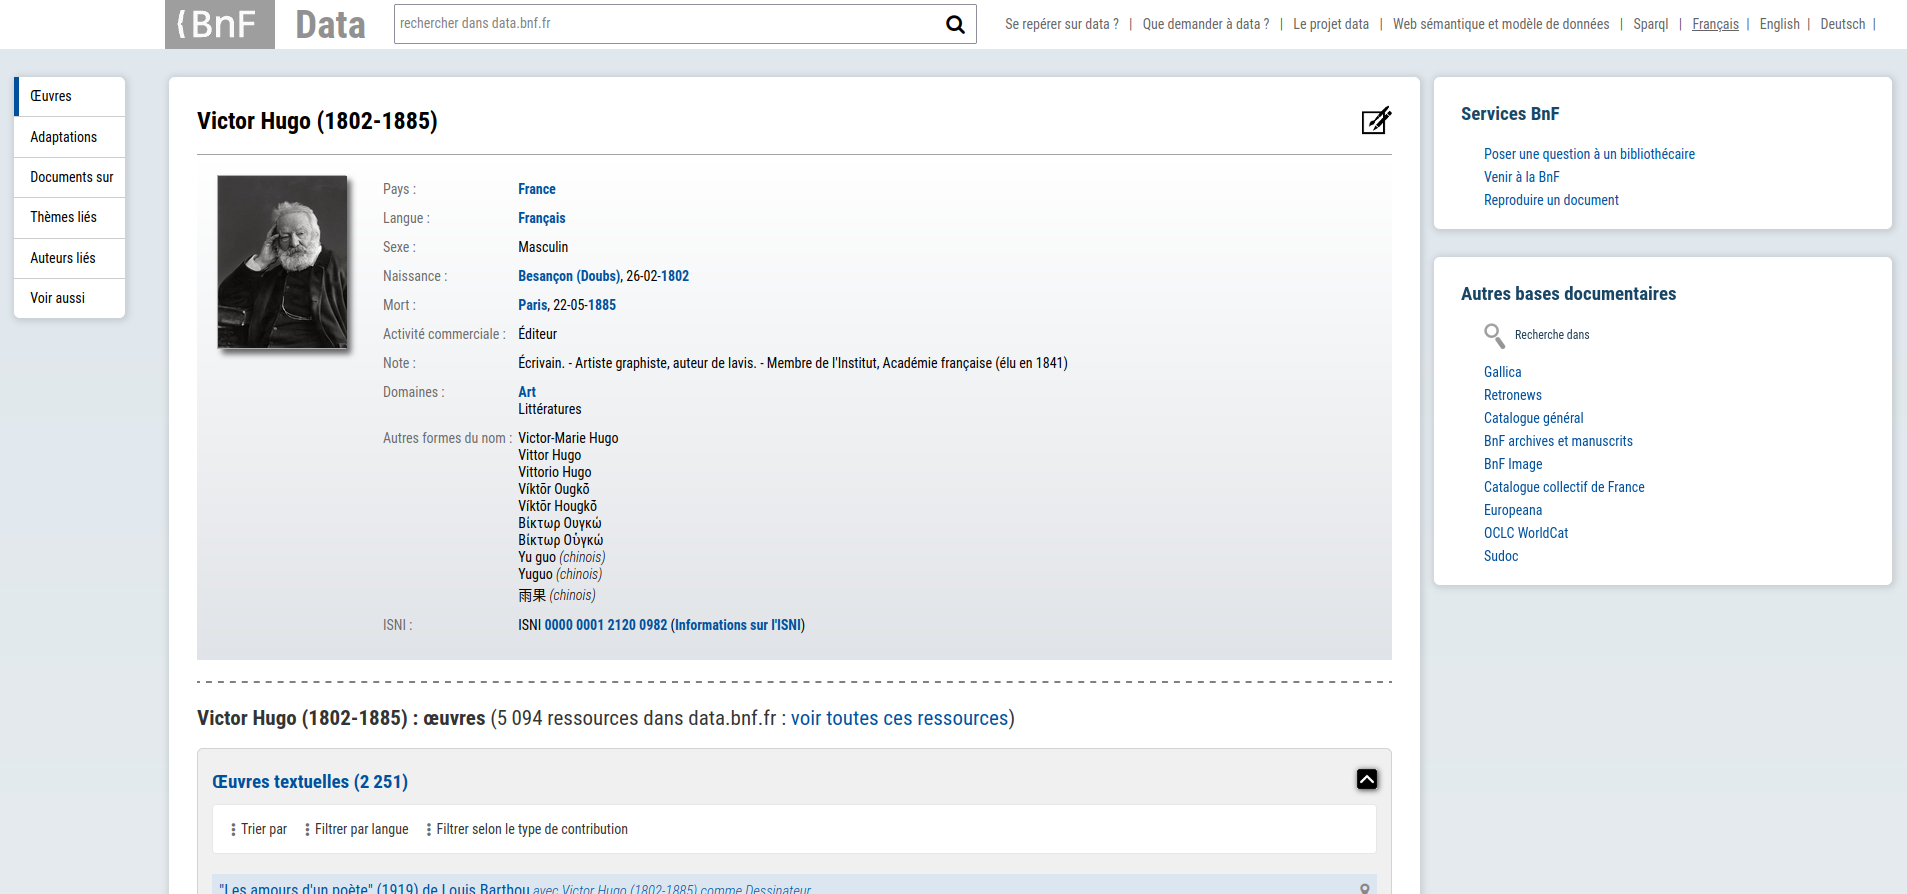
This website of the French National Library (BnF) publishes the description of millions of entities (works, authors, edition, themes, places) that are used as references for hundreds of actors in the library domain.
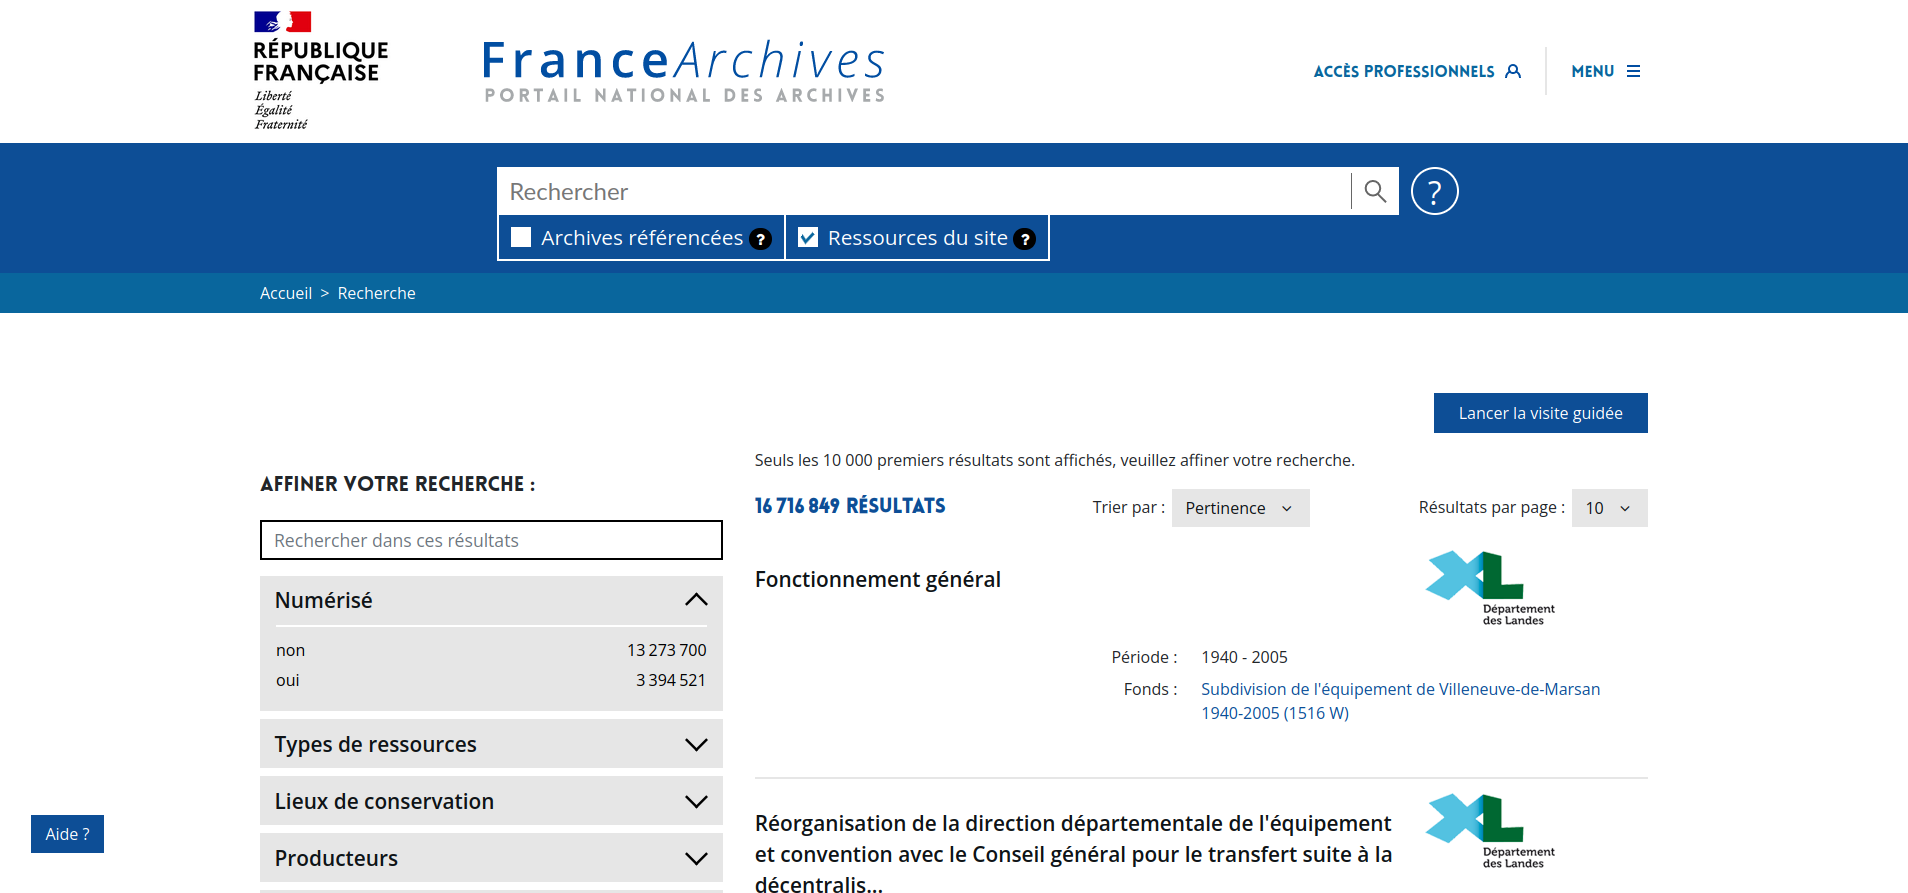
This portal offers to search among hundreds of thousands of entities (persons, places, organisations, documents, etc) described by the local and national French archives services.
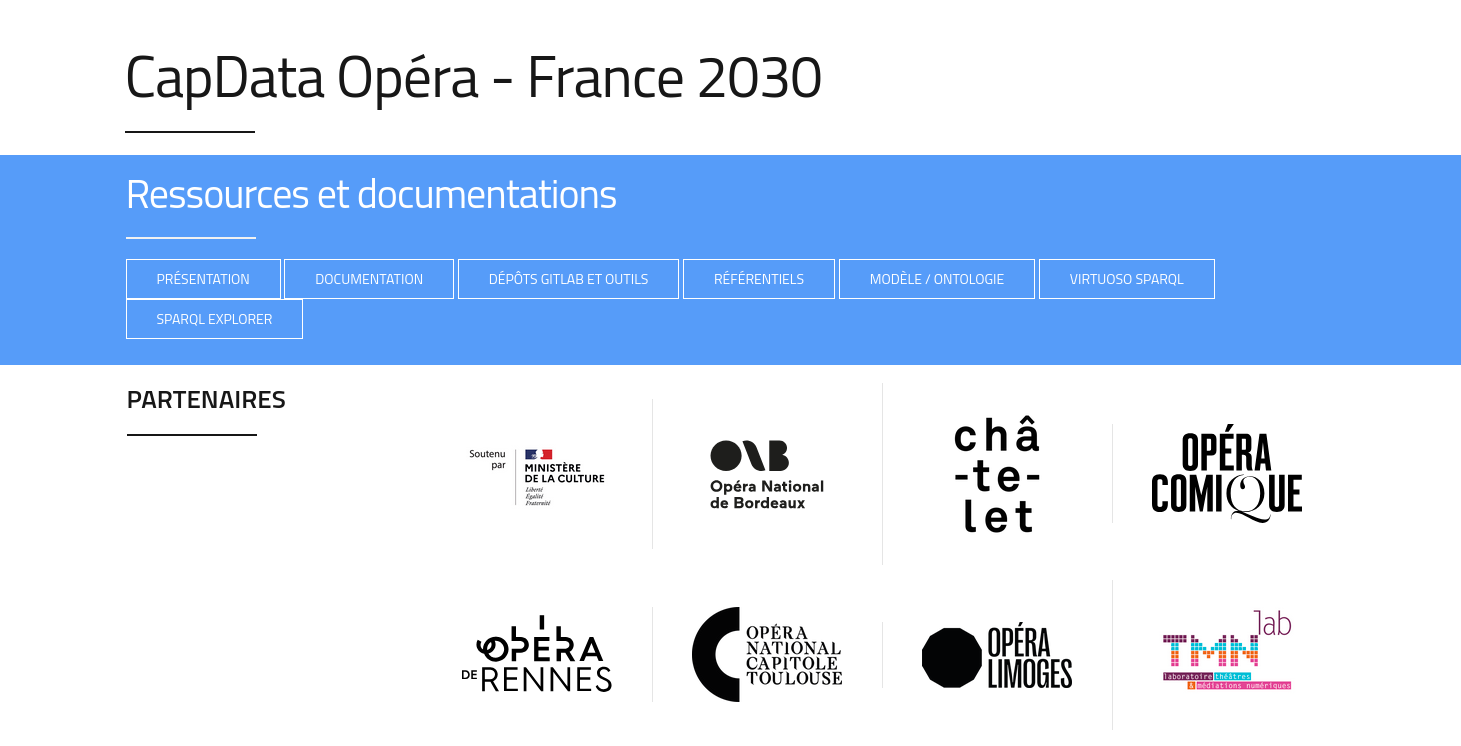
The CapDataCulture ontology is used by the French Opera Houses to aggregate and publish their catalog of works, artists, events, etc.
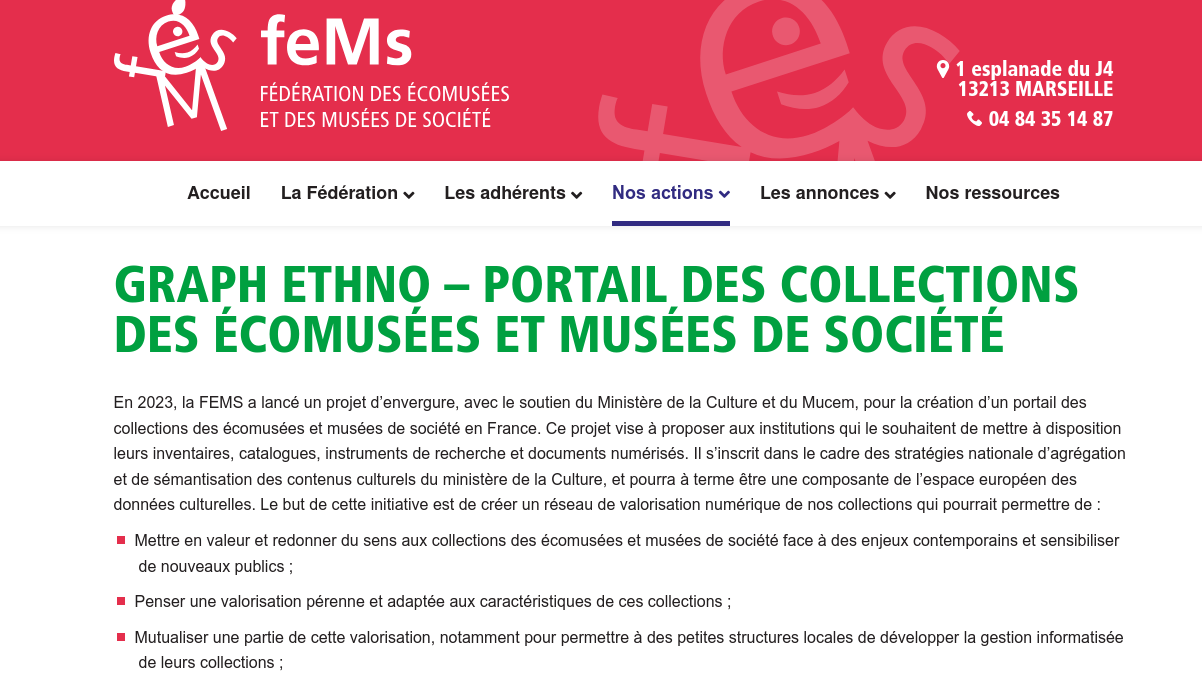
The museums that are members of the FEMS association publish a common catalog for the objects of their collections.
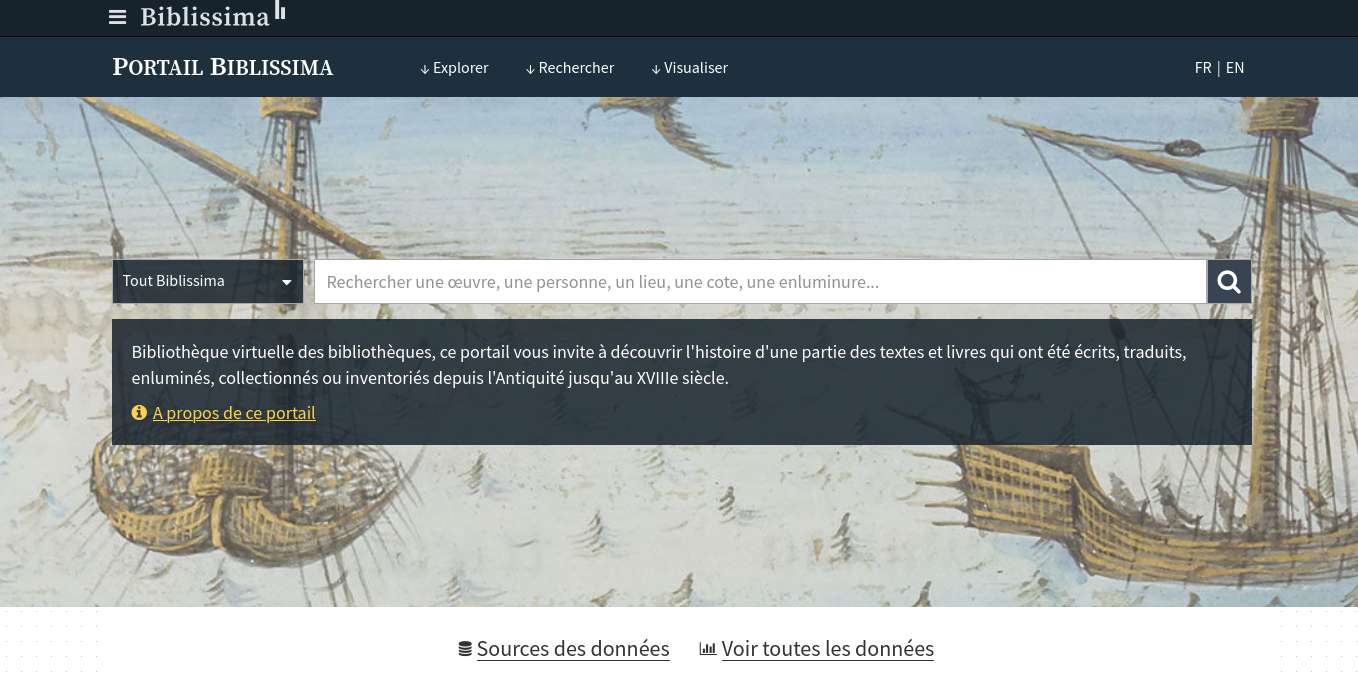
This portal is a virtual library of libraries: discover the history of various texts and books that were written, translated, illuminated, collected and catalogued from Classical Antiquity through the 18th century.
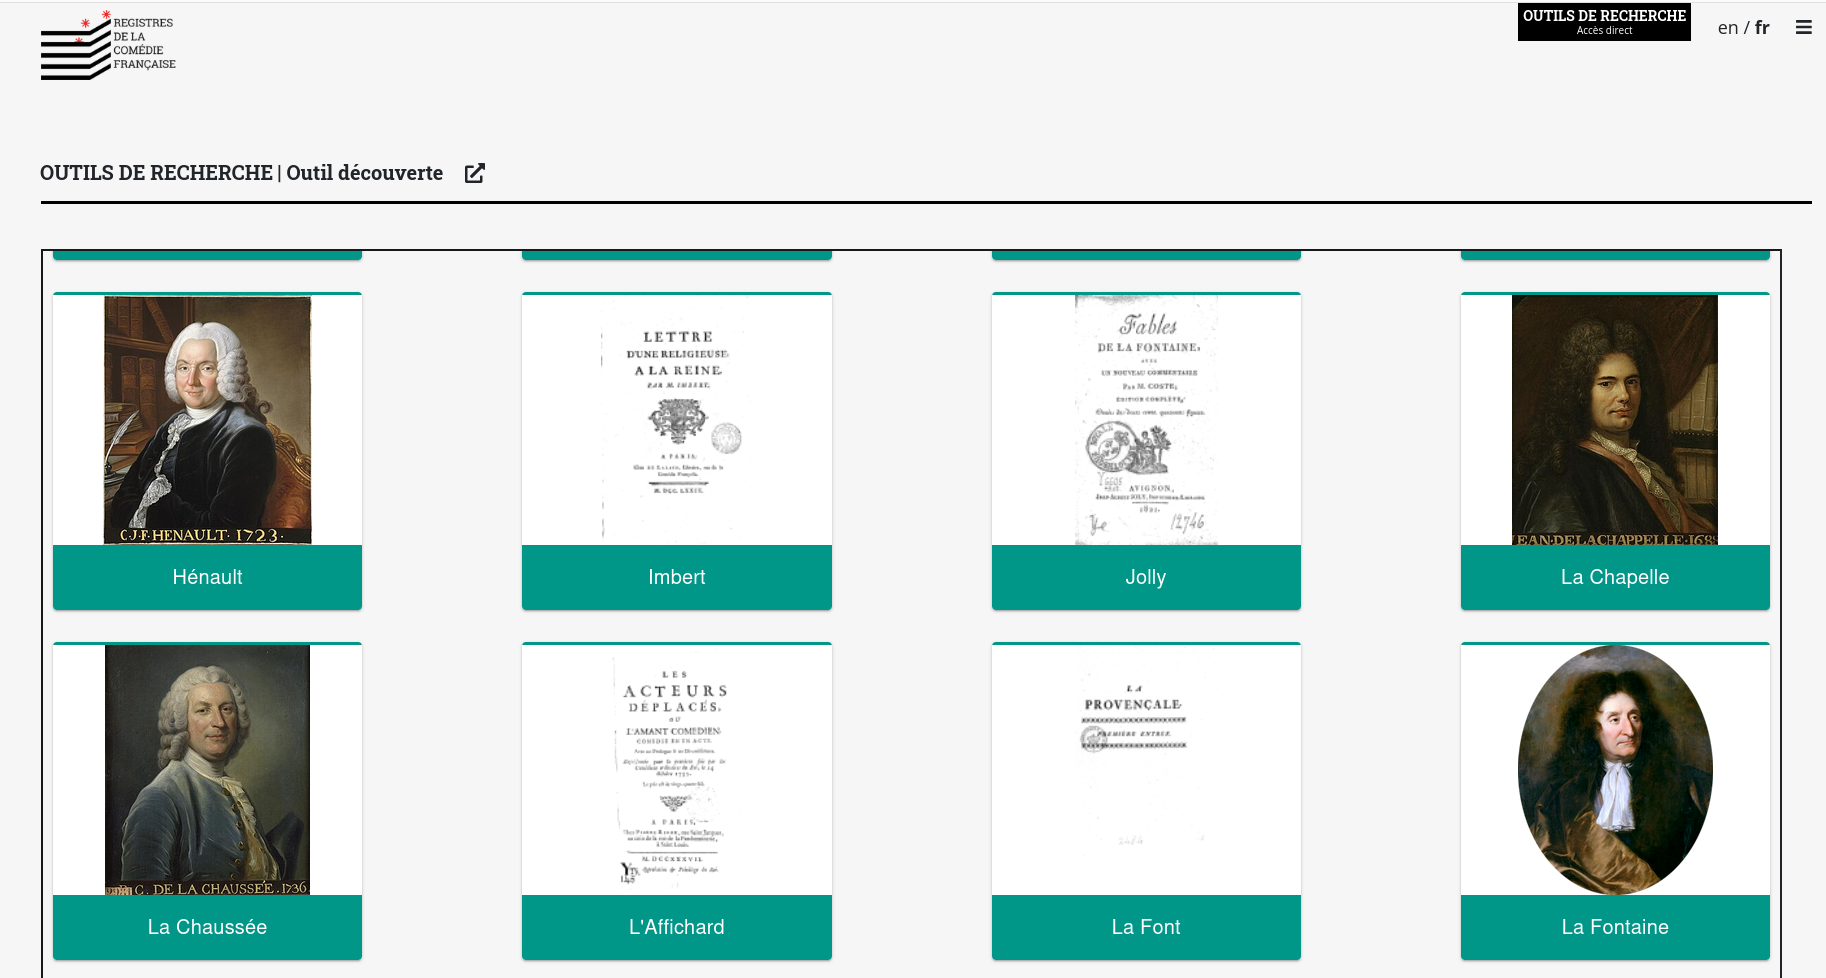
The accounting registers of Comédie Française where digitalized and can be accessed as raw data or via adhoc tools.
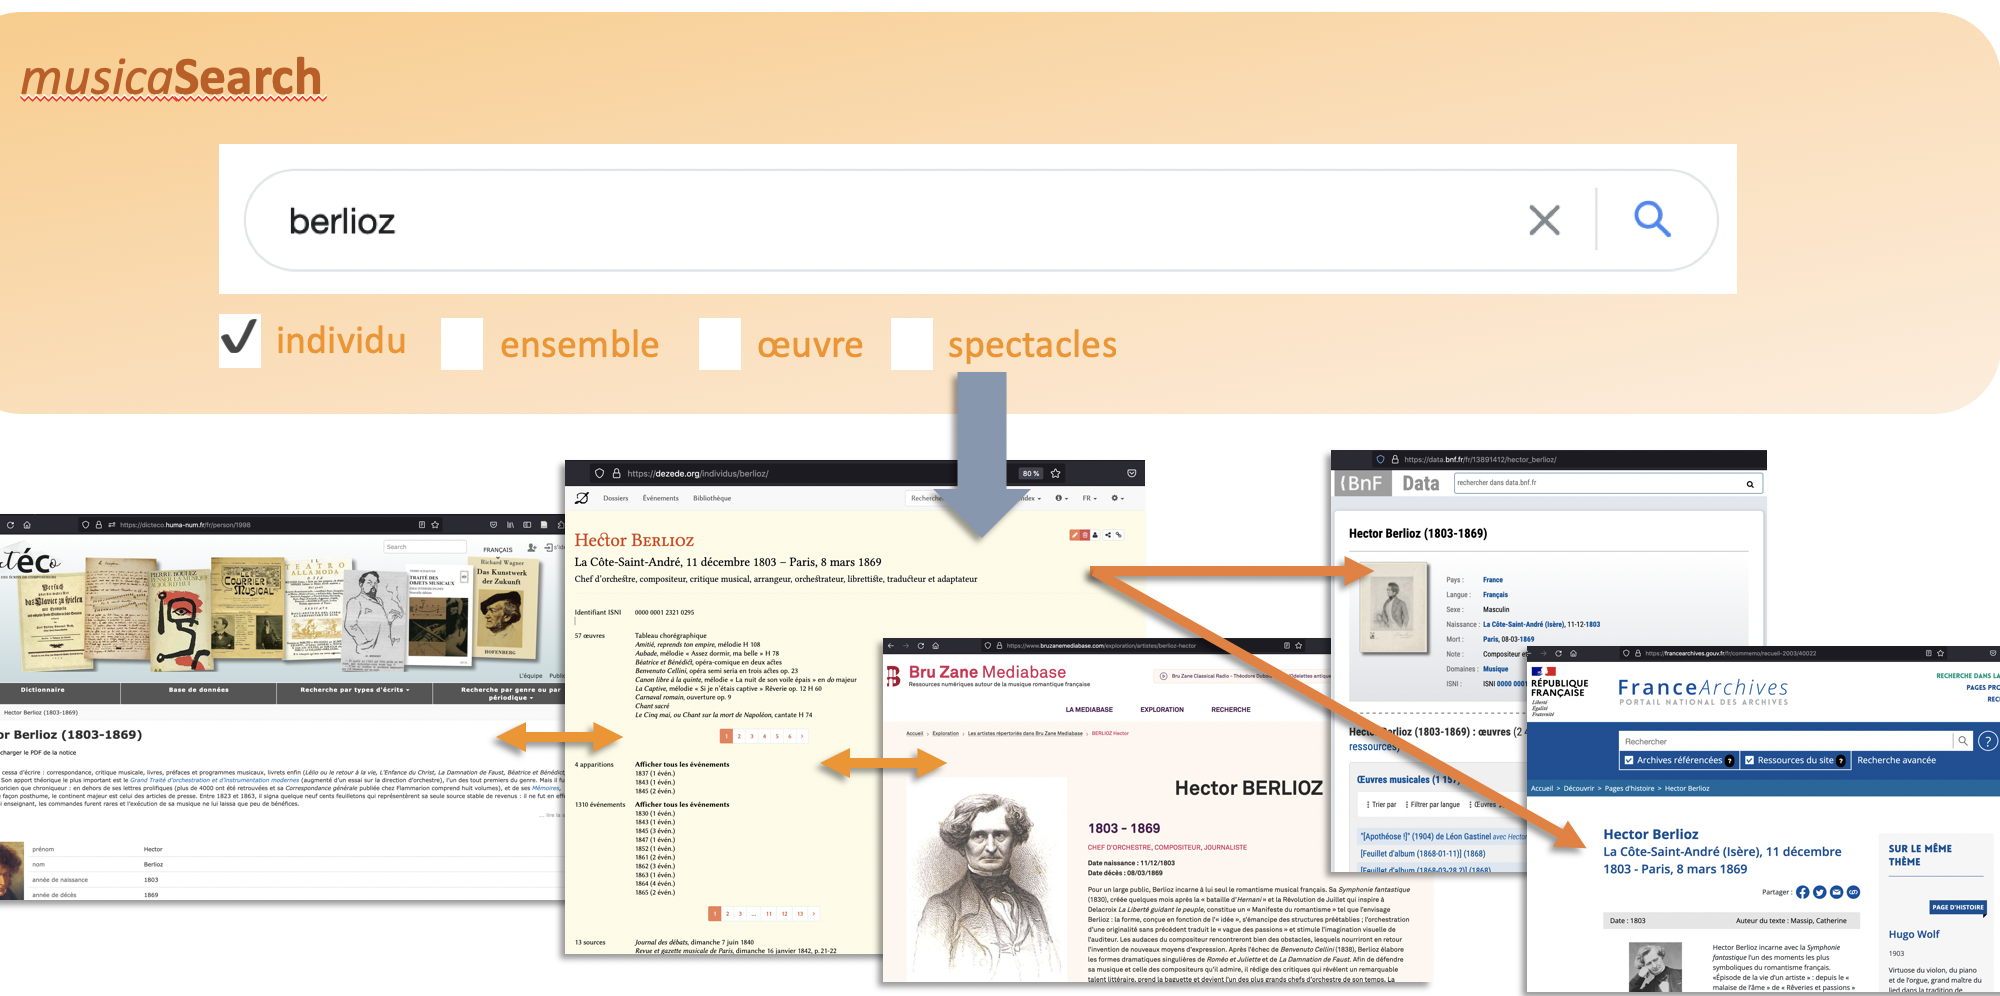
This search engine focused on musicology allows to get results from several on-line databases with a single query.

These portals restricted to internal use allow to build a transversal view of industrial assets by merging the data from several data silos into a common graph (building, equipments, sensors, documents, actors, applications, etc).